Living Data
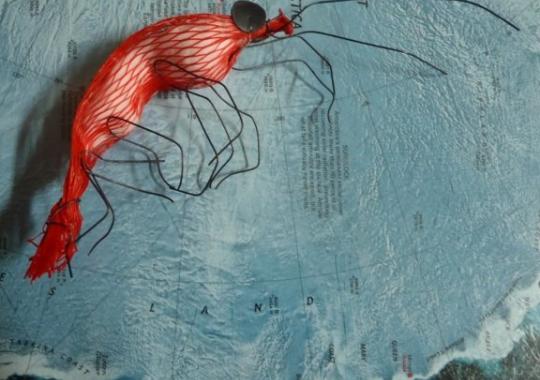
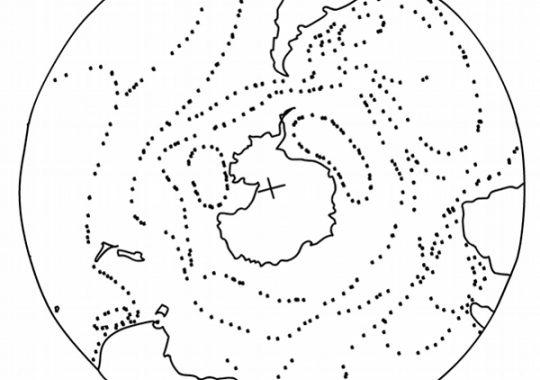
Can a collaborative animation practice expand perceptions of our place within the global ecosystem? This is the research question of the Living Data project. Living Data builds on the Antarctic Animation project that evolved through a collaborative animation practice. Living Data similarly evolves, through mutually beneficial (symbiotic) relationships that develop with scientists and other artists. Collaborators share data and iconography for the purpose of expanding understanding our place within the global ecosystem. People who have visualised climate change data and the effects of climate on people are invited to contribute images and animations to the archives. New animations are made in collaboration with scientists and visual and performing artists. Data and iconography are identified in the archives that can contribute to an evolving Big Picture overview. The Blog documents collaborative methods that are used to develop animations and designs for visualising a Big Picture. The Blog enables open dialogues between collaborators, contributors and observers. Core scientific data come from the Climate Change Cluster,University of Technology, Sydney, and the Australian Antarctic Division. While I may be the one who leads the storytelling of Living Data, the story I present does not belong to me or even to the amalgamation of research participants. The story is part of the relationships between us that contribute to visualising a wider view. Your contributions and comments are welcome! Dr Lisa Roberts, Visiting Fellow Faculty of Design, Architecture & Built Environment (DAB) University of Technology, Sydney
- Login to post comments
-

